theses graphics show the preferences of the group 4c.
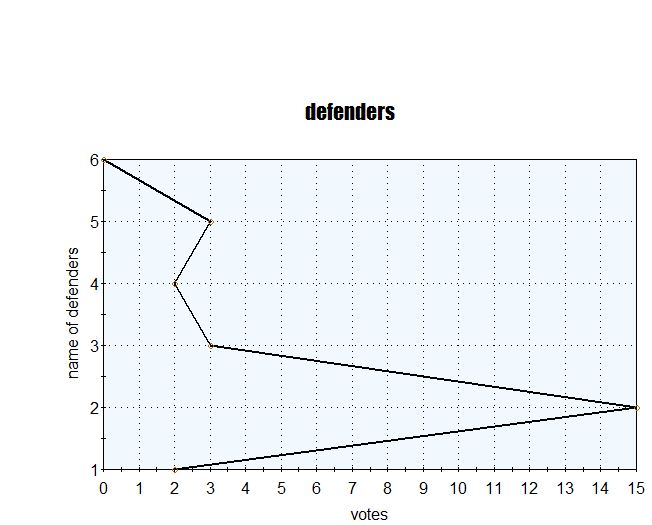
the first graphic is about theams of europe. the second it is about teams of colombia and finally the third it is of soccer defenders.
for knowing the results, the data was collected for interviews. after collecting the information, the graphics were done and finally there was an analysis of that graphics with some results.
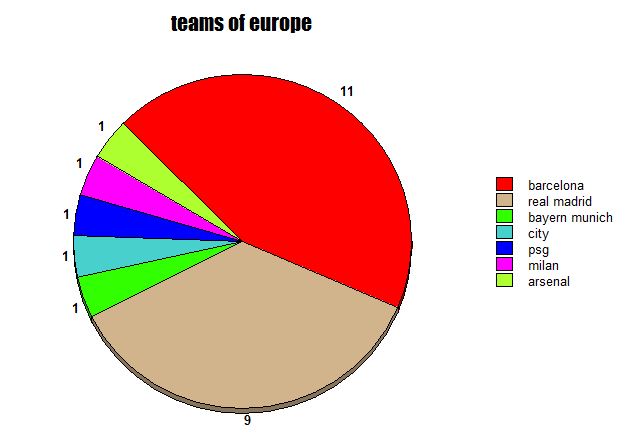
the graphic shows that people prefer barcelona, but arsenal is not better. this graphic is about teams of europe
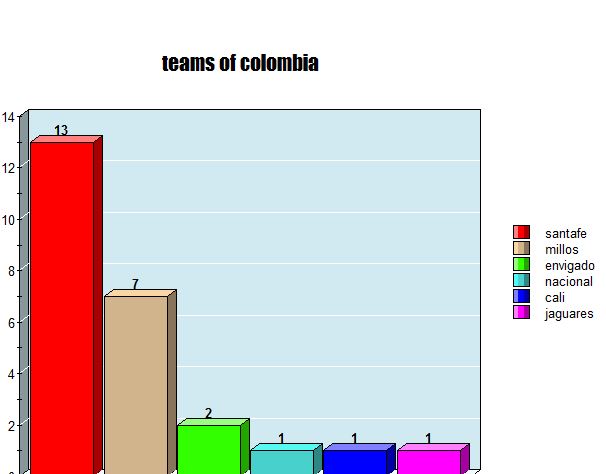
people of 4c like more teams of colombia santafe with 13 votes and they don't like jaguares